With constant talk of recession, inflation and financial uncertainty, it’s no surprise that many investors feel uneasy, especially when the stock market rises one week and dips the next, mirroring the shifting economic landscape. That kind of movement, known as market volatility, can make anyone second-guess their strategy. But what if we could shift the perspective: seeing those swings not as something to fear, but as something to understand and even use?
Volatility refers to how much and how quickly an investment’s price moves over time. Bigger, more frequent swings mean more volatility, but that doesn’t necessarily signal a problem. Far from being a flaw in the system, volatility is a natural and essential part of healthy markets.
Still, for many investors, those ups and downs feel personal, not only because they affect the value of hard-earned savings, but also because they challenge individual comfort levels and can prompt very different reactions. Some see volatility as a chance to capitalize on price swings, while others view it as a warning sign. That's why it’s so important to view volatility in context and not mistake short-term shifts for the full story.
What the Current Market Can Show Us
Consider the current investing landscape. The below charts from FCI Advisors, for example, illustrate how different parts of the market have performed this year, from equities (stocks) and fixed income (bonds) to large-, mid-, and small-cap stocks. Generally, large- and mid-cap stocks represent well-established companies, while small caps tend to be newer, more growth-oriented, and often more volatile. So far, equities have outperformed fixed income by a wide margin, with large- and mid-cap stocks outperforming small caps.
INDEX RETURNS
Equities (%)
| WTD | MTD | YTD | |
|---|---|---|---|
| S&P 500 | -0.31 | 0.92 | 7.18 |
| DJIA | -1.02 | 0.67 | 5.25 |
| Nasdaq | -0.08 | 1.09 | 7.01 |
| Russell 1000 | -0.38 | 0.89 | 7.06 |
| Russell 2000 | -0.63 | 2.78 | 0.94 |
| Russell 3000 | -0.39 | 0.97 | 6.77 |
Fixed Income (%)
| WTD | MTD | YTD | |
|---|---|---|---|
| US Intermediate Gov/Cred | 0.07 | -0.32 | 3.80 |
| U.S. Aggregate | 0.04 | -0.40 | 3.60 |
| US Corp High Yield | -0.08 | 0.13 | 4.70 |
| Municipal Bond | 0.14 | 0.11 | -0.24 |
Returns YTD (%)
| VALUE | CORE | GROWTH | |
|---|---|---|---|
| Large Cap | 7.12 | 7.06 | 6.87 |
| Mid Cap | 5.23 | 6.24 | 8.93 |
| Small Cap | 1.31 | 0.94 | 0.57 |
SOURCE: FCI Advisors
What does that tell us?
On one level, it suggests many investors are leaning toward stability over bold bets, favoring large and mid-cap stocks or lower-risk assets that tend to hold up better in uncertain environments. But remember, these charts are still just snapshots. They reflect a range of investment styles and risk levels. While they can help us check in — like a trail marker showing where we’ve been — they don’t reveal what kind of terrain lies ahead or whether the path still aligns with our ultimate financial destination.
More importantly, they don’t reflect the most important variable in investing: you. What you believe about the market — whether you’re nervous about big swings, worried about a recession or think interest rates might drop — plays a big role in building a portfolio. It helps determine the mix of investments you should have and the ones that make most sense for you.
Managing Investment Risk: It's About Your Comfort
Every investor faces a unique puzzle, and one of the most important pieces is understanding how you define and respond to risk. In investing, risk is defined as “the chance that an outcome or actual gains will differ from an expected return,” according to Investopedia. And, as you might guess, one of the primary ways we measure that risk is through our old friend, volatility. The more volatile the asset allocation, the riskier it is.
That said, people define risk in widely different ways. For some, it’s the fear of losing money. For others, it’s missing out on growth. That’s why it helps to understand different types of risk:
- Interest rate risk: Changes in interest rates reducing investment value (especially bonds)
- Market risk: The chance the entire market (or a segment) will decline, pulling investments down
- Liquidity risk: Not being able to sell an investment quickly without affecting its price
- Concentration risk: Having too much of your portfolio in one asset, sector or company
- Inflation risk: Rising costs eroding purchasing power if investments don’t grow fast enough
One of the common ways to reduce risk in a portfolio is through a process called diversification, spreading investments across different asset classes, industries, companies, asset types and management styles. The general idea is that if one segment of the economy is struggling, another segment may hold steady or rise, helping reduce overall volatility in your portfolio.
Even with a well-diversified plan, it’s easy to feel uneasy when your portfolio isn’t showing steady progress, especially if you’re comparing it to market benchmarks like the S&P 500.
Why Market Averages Don’t Tell the Whole Story
From 1984 to year-end 2023, the S&P 500 Index had an average annual return of about 11%. That sounds steady, right? In reality, it only returned between 9 and 12 percent three times during that 40-year stretch. Every other year, returns were either above or below that range, sometimes significantly. That’s a clear example of volatility at work.
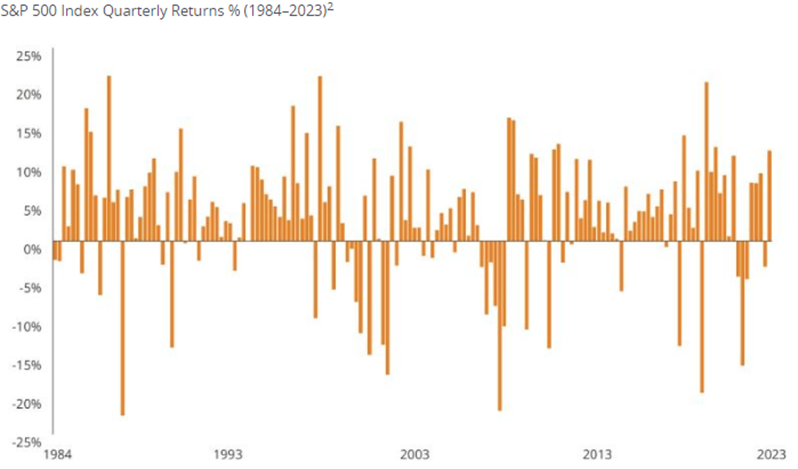
SOURCE: Hartford
Still, many investors expect their portfolios to mirror those averages year after year. When markets don’t produce positive returns in a given year, it’s natural to wonder if something’s gone wrong. But that reaction often stems from how market performance is commonly presented. Positive returns come as an average over time, not a consistent, linear outcome every year.
Unfortunately, the media and other sources tend to highlight short-term swings without much long-term context. That can lead to misunderstandings about how markets really behave. This fuels unnecessary concern and sometimes creates a kind of false alarm that tempts investors to abandon well-built plans during normal market cycles.
Volatility as Opportunity
That doesn’t mean volatility is easy to stomach, but it can be powerful when used wisely.
Let’s look at two hypothetical investors, each starting with $10,000 in the S&P 500 on January 1, 1984:
- Investor A (Defensive Approach): Every time the stock market dropped 8 percent or more in a single month, they moved $2,000 out of the market and into Treasury bills (T-bills). T-bills are short-term government securities considered low-risk and low-return, often used as a haven during market downturns.
- Investor B (Opportunistic Approach): In contrast, this investor took each market dip as a chance to buy more. Every time the market fell 8 percent or more in a month, they invested an additional $2,000 in the S&P 500.
According to Hartford data (include chart), Investor B — the one who leaned in — came out significantly ahead. Why?
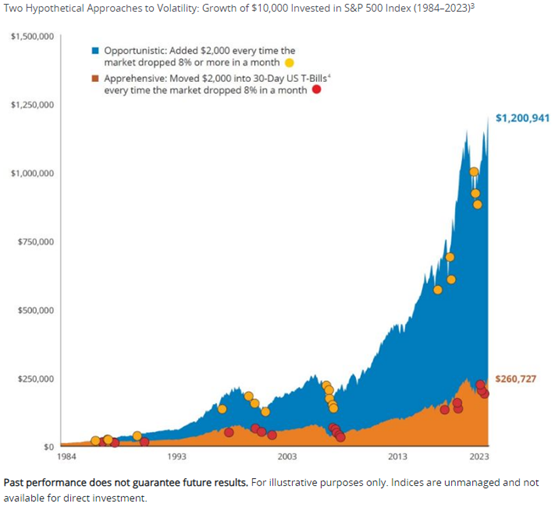
SOURCE: Hartford
Because volatility cuts both ways:
- When the market drops, prices are lower, allowing investors to buy more shares for the same amount.
- When the market rebounds, lower-cost shares often see greater gains.
Even legendary investor Warren Buffett takes this long-term view. One of his most famous recommendations is that the bulk of his fortune be invested in a low-cost S&P 500 index fund after his death, not because it’s flashy, but because over time, it works. Like Investor B, Buffett’s strategy isn’t about avoiding volatility but trusting the process through it.
Your Partner in Long-Term Investing
In investing, time matters more than timing, meaning it’s not about guessing the perfect moment, but about staying the course and letting your investments grow over time. While markets move unpredictably in the short term, a consistent, long-term approach often leads to better outcomes than chasing headlines or reacting to market pressure.
At Bank of Utah, we view the custodianship of your assets as a responsibility we take seriously. Our advisors take a comprehensive approach, factoring in your goals, comfort with risk, time horizon and full financial picture to build a plan designed to last.
Whether you prefer a fully managed approach or want to make your own investment decisions with guidance available when you need it, we offer flexible solutions to support your goals, including access to tools and expertise through our partnership with OUTCOME.

Aaron Walker has more than 19 years of experience in banking and finance, with a background as both a financial advisor and private banker. As senior investment officer at Bank of Utah, he oversees securities, trade approvals and portfolio allocations to help clients make the most of their assets. Outside of work, he enjoys board games, exploring new trails and discovering great food with his family.
DISCLAIMER: Personal trust/investment products are not FDIC insured and may lose value.